The Kaladin
Crucible.
A multi-gate analysis pipeline that interrogates financial quality, growth, moat durability, management effectiveness, diversification, and market position, then distills it into the Kaladin Quality Index.
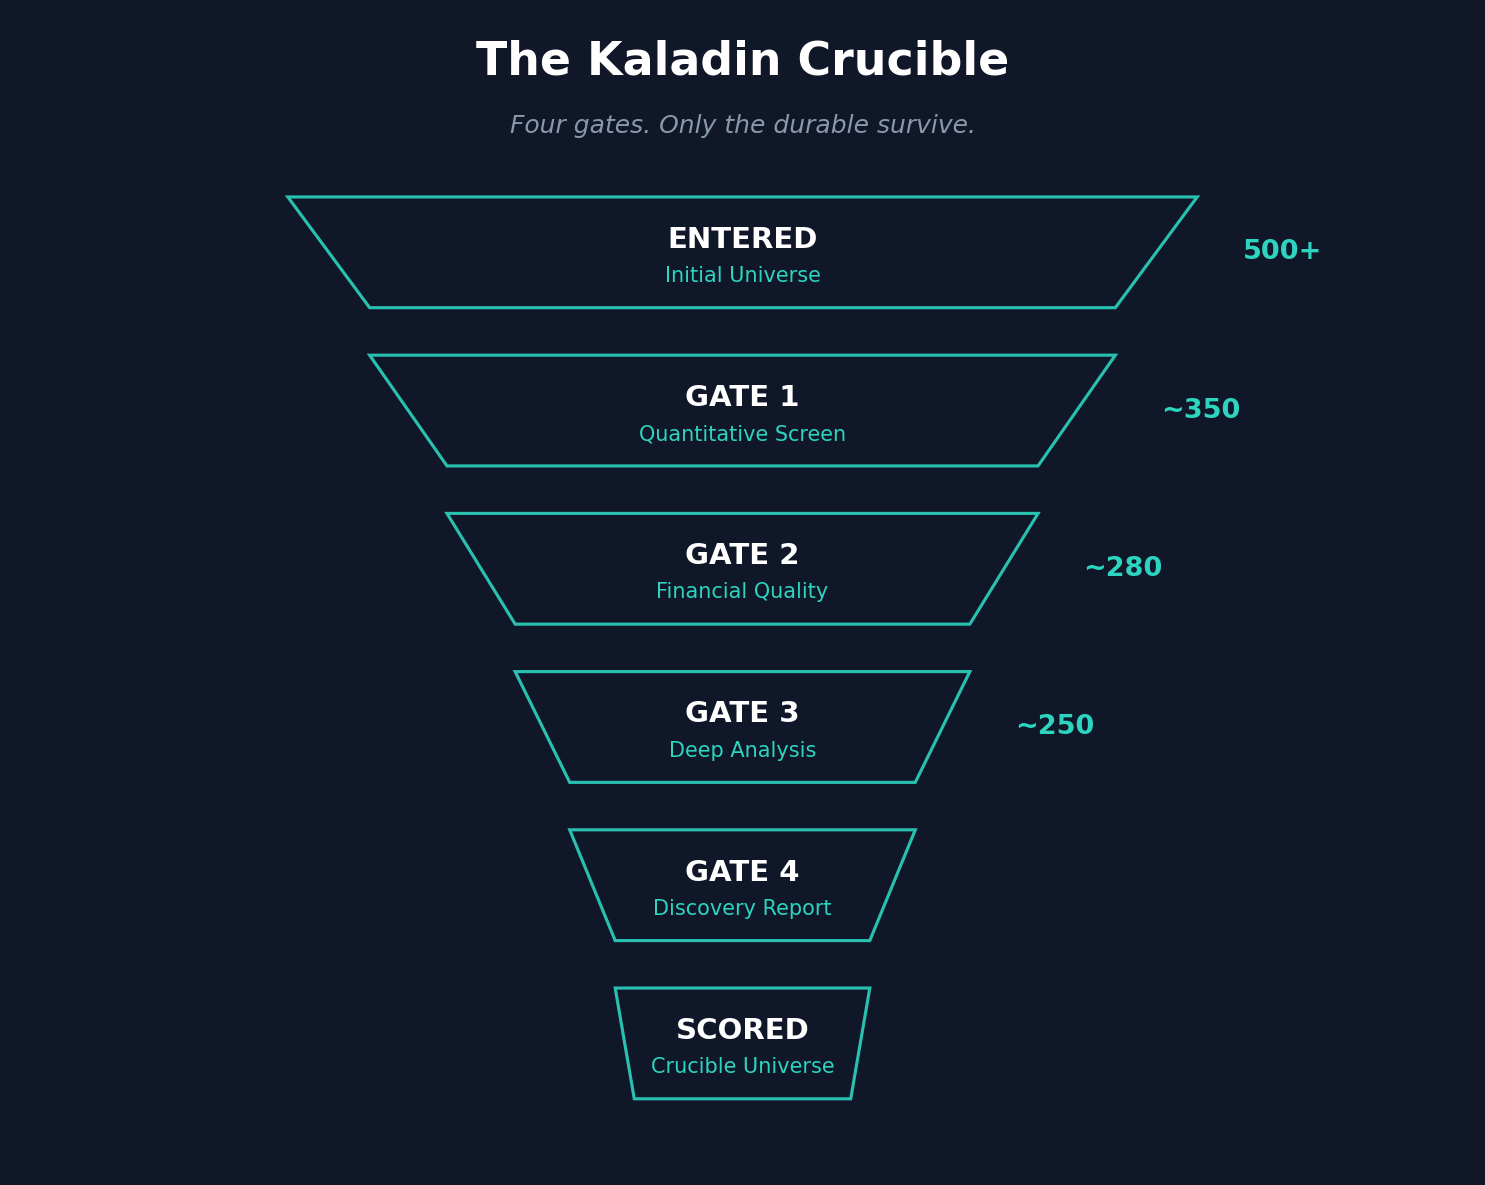
Four Gates. Only the Durable Survive.
Screening
The First FilterEvery company begins here. The Screening gate evaluates fundamental financial health, growth thresholds, and viability markers. Companies that don't meet baseline quality standards are eliminated before deeper analysis begins.
Quantitative
Deep Financial AnalysisSurvivors of Gate 1 face rigorous quantitative examination. This gate dissects financial statements across multiple years to surface patterns in margin quality, capital allocation efficiency, and returns on invested capital.
Qualitative
Beyond The NumbersNumbers tell part of the story. Gate 3 evaluates what financials alone can't capture: the durability of competitive advantages, the quality of management teams, and the strategic positioning that determines whether today's quality persists.
Conviction
The Final JudgmentThe most rigorous gate. Companies that survive to Gate 4 receive full narrative analysis, DCF valuation modeling, comprehensive risk assessment, and their final Kaladin Quality Index score. The output is a complete discovery report.
Six Dimensions of Quality
The KQI evaluates every company across six weighted dimensions, producing a composite score from 0 to 100.
Moat Durability
Margin stability, pricing power, R&D intensity, and revenue durability. The single most important dimension, because a moat that erodes eventually destroys all other quality signals.
Financial Quality
Margins, ROIC, balance sheet strength, cash conversion, and capital intensity. The foundation that everything else builds on.
Management Effectiveness
Capital allocation discipline, compensation structure, insider activity, tenure, and founder-led dynamics. Great businesses need great operators.
Growth Profile
Revenue and earnings CAGR, growth consistency, segment breadth, and acceleration patterns. Growth matters, but only when it's durable.
Market Position
Competitive standing, analyst coverage, and disruption exposure. Where a company sits relative to its industry and what threatens that position.
Diversification & Resilience
Revenue concentration, geographic mix, and revenue stability. Companies that depend on one product, one customer, or one country carry hidden risk.
Beyond Quality: The Crucible Score
Quality alone doesn't make an investment. The Kaladin Value Index (KVI) adds a valuation layer, and the two combine into the Crucible Score.
KQI: Quality Index
The quality side. Six dimensions, 36+ components, four analytical gates. Measures how good a company is: financial strength, growth durability, moat depth, management effectiveness, diversification, and competitive position.
KVI: Value Index
The valuation side. DCF modeling, free cash flow yield, relative valuation, growth-adjusted pricing, and historical context. Measures how fairly priced a company is relative to its intrinsic value.
The Intersection Is the Edge
A high KQI with a low KVI means a great company at a bad price. A high KVI with a low KQI means a cheap stock for a reason. The Crucible Score finds the overlap: quality companies at fair to good valuations.
Good companies at good to fair value = highest probability wins.
The Grade Scale
KQI scores translate to letter grades that provide immediate, intuitive context. An A-tier company has demonstrated consistent quality across all six dimensions. Grades below B- signal meaningful weaknesses worth scrutinizing.
A consistency bonus of up to +4 points rewards companies with balanced dimension scores, because quality across the board matters more than excellence in one area and weakness in another.
Built on Primary Sources
The Crucible draws from authoritative, regulated data, not scraped headlines or social sentiment.
SEC EDGAR
10-K, DEF 14A, Form 4, 8-K filings
Financial Data APIs
Financials, estimates, and scores
FRED
14 macroeconomic indicators
Quarterly Financials
Revenue, margins, segment data
See the Crucible in action.
Every Tuesday, The Crucible Brief delivers company deep dives, KQI scorecards, and peer comparisons directly to your inbox.
Subscribe Free